A while ago i gave u the first look into Dataon Must, Dataon’s monitoring system that comes with their S2D servers.
Today i want to give you an insight into a new offering that is coming, Barton Glass. Barton Glass is built by Barton Systems member of the Cronos group and 2016 Microsoft Partner of the year in Belgium.
The system comes in two different ways
- As a converged Storage solution integrated with Barton Managed Storage services, based on S2D technology against a monthly fee
- As a standalone monitoring solution for your existing S2D setup
Both solutions will give you a easy to use gui that you can use to monitor your S2D solution and perform tasks and view the health of your system.
When i started looking into Barton Glass a there where a lot of things here that peaked my interest. Easy manageability of virtualdisk’s, a good front overview and easy to understand GUI.
Let’s have a look at how the GUI looks like
The first page you come to when logging in is the Dashboard

Here you have a good overview of what’s going on with your S2D Cluster.
- Health Volumes shows the health of your Virtual Disk.
- Storage Latency will show you the storage latency.
- Node Hardware will show you when there is any issue with nodes’s hardware(it’s yellow here as the S2D cluster is a HP G8 based solution and not all HW metrics are reconized as G8 is not qualified for S2D).
- System Reserve will show you the reserved disk size on the Storage Pool to do a disk rebuild when a disk fails.
- Health Ports will show you if there is any issue with the Network ports on your switch if it’s configured with SNMP.
- Health SMB will let you know if there is an issue with your SMB traffic, let’s say you are missing SMB multichannels on 1 host.
- Fabric Hardware will use SNMP to monitor your Switchs for any issues with them.
- Barton Service is a connection to Barton’s central system for proactive support or alerting services of any issues. (Since this is a test system it is NOT hooked up to the Barton proactive analytics monitoring system that keeps an eye on your system 24/7)
On the next page (Kiosk Resources) we will have an overview of the storage pool and the virtual disks resources.

This will give you an overview of
- The size of the pool with the pools reserve and free space
- A list of the Virtual disk’s, their size and used and free space. Along with an estimate of usage growth
- IOPs, Latency and Throughput
- It will also show any errors on the S2D fabric, and the nodes.
All of this gives you an easy to see Resource Dashboard for quick views.
The next page will give you the ability to Provision virtual disks.

- Here you can add a new virtual disk(volume)
- Extend current virtual disk
- Delete virtual disk
- Create and delete Scale Out Fileserver Shares and visualize the folder structure and filenames on any given share(note:Access to the file content itself is prohibited to comply with privacy and segregation of duty)
- Enable Dedupe on the Volume(will be available in upcomming Windows Server 2016 1803 build available for test on Insider preview S2D)
- Enable Virtual Disk Replication with Storage Replica.
When we move into the Node Performance we get a good overview of the total system performance as well as for each node individually.
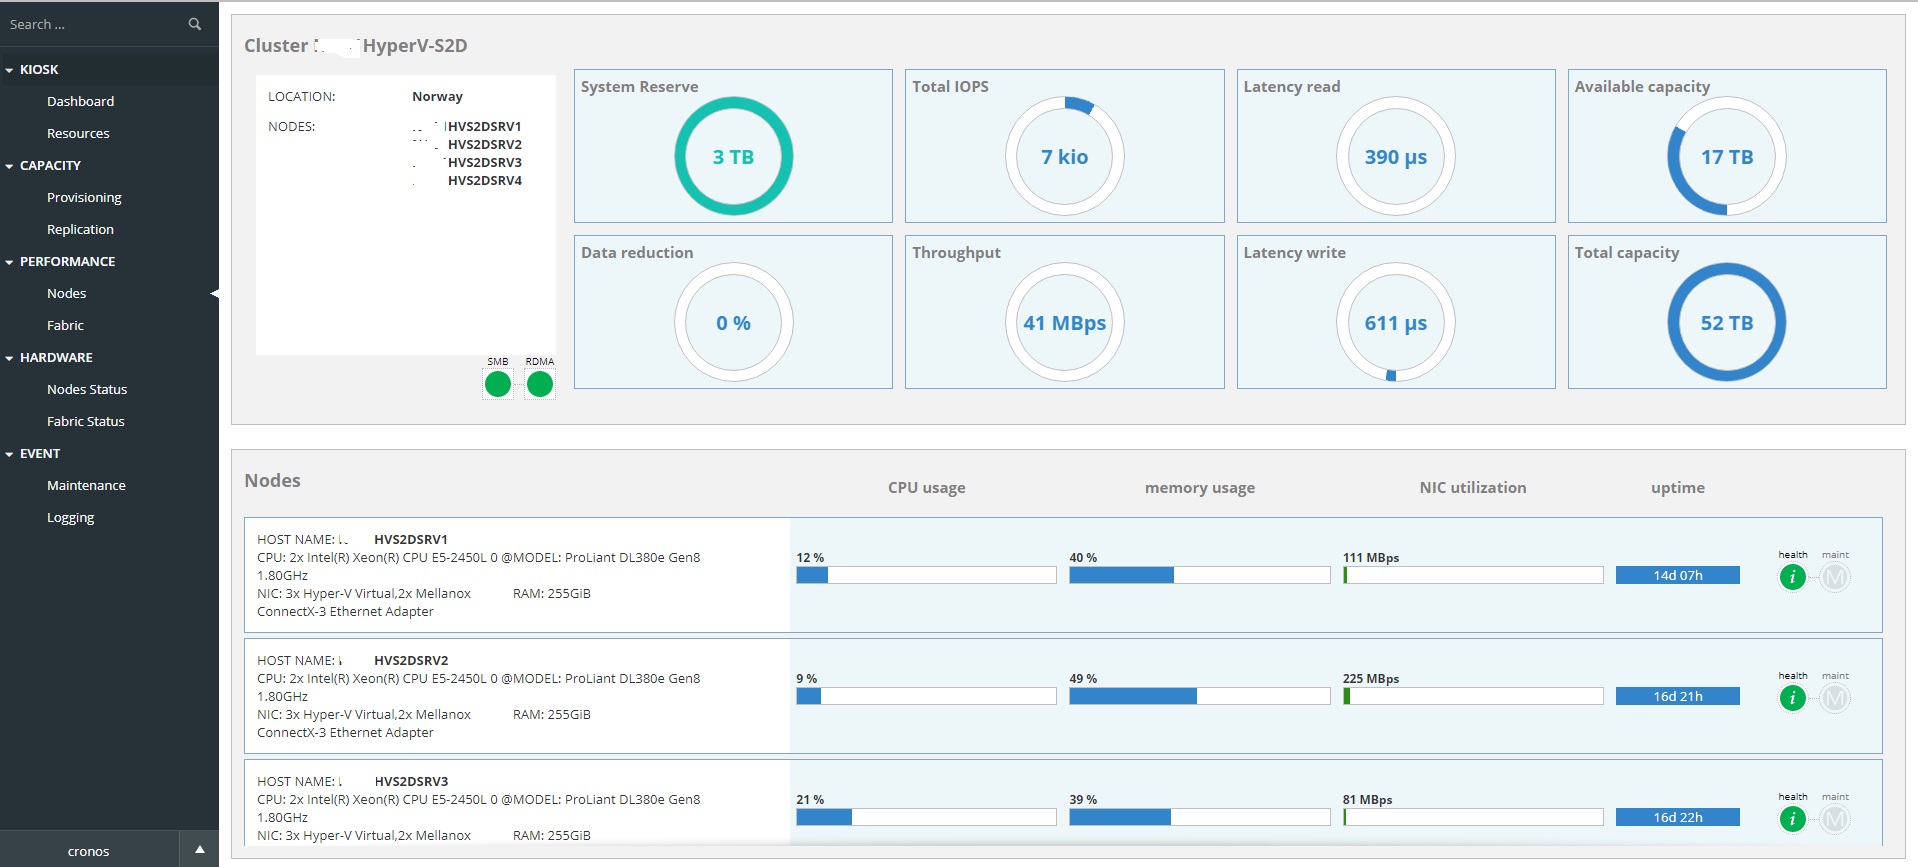
For the cluster
- We again see the System Reserve donut
- Total IOPs on the cluster
- Read Latency
- Available Capacity
- Data Reduction(dedupe)
- Throughput
- Write Latency
- Total Capacity
- And SMB and RDMA status (green or red)
On the Nodes
- We get an overview of nodes hardware.CPU, Memory, Server Model, Virtual NICs and Physical NICs.
- CPU Usage
- Memory Usage
- NIC Utilization
- Node Up Time
- Health Status
- Maintenance Status
On the Fabric page we get an overview of the switches connected to the S2D servers via SNMP. My setup is using Dell Force 10 S4810p switches for wich the SNMP library is not available yet but will be soon. So there is not much to see here. This is combined with the Storage metrics.
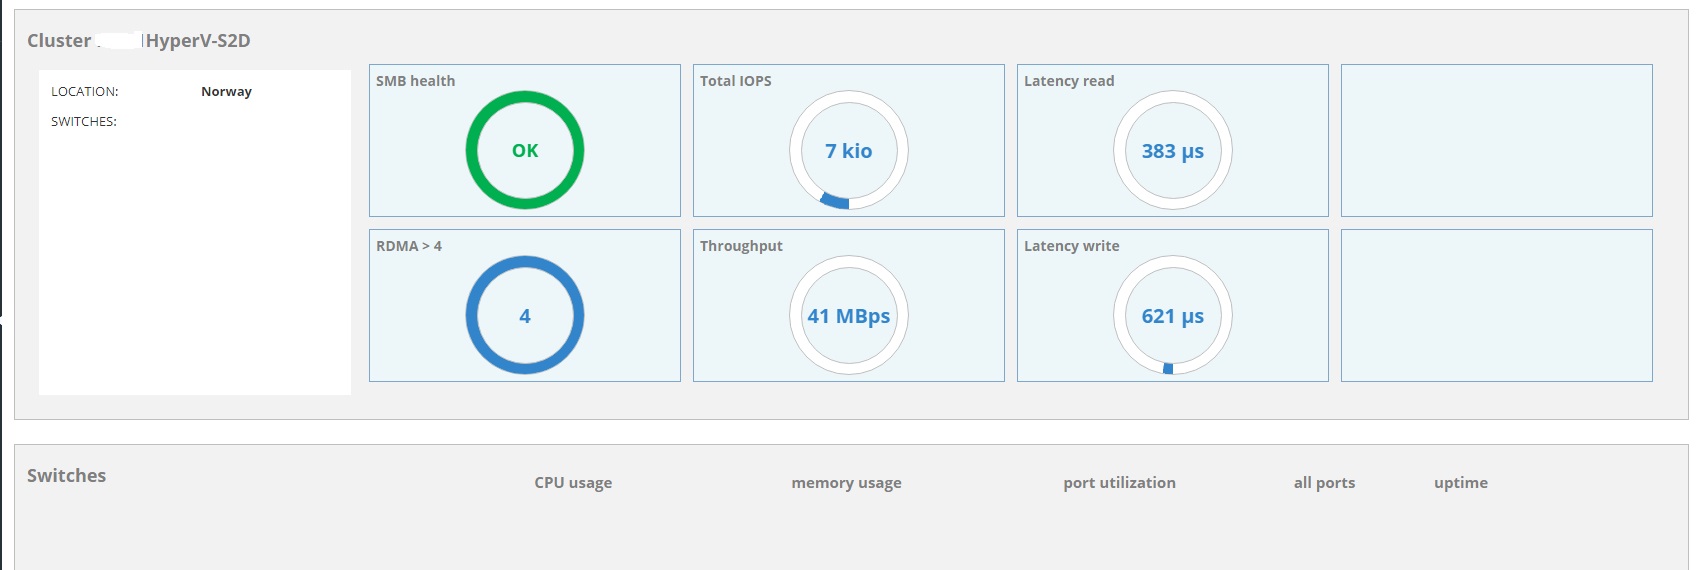
Added some Barton provided screenshot of the fabric page
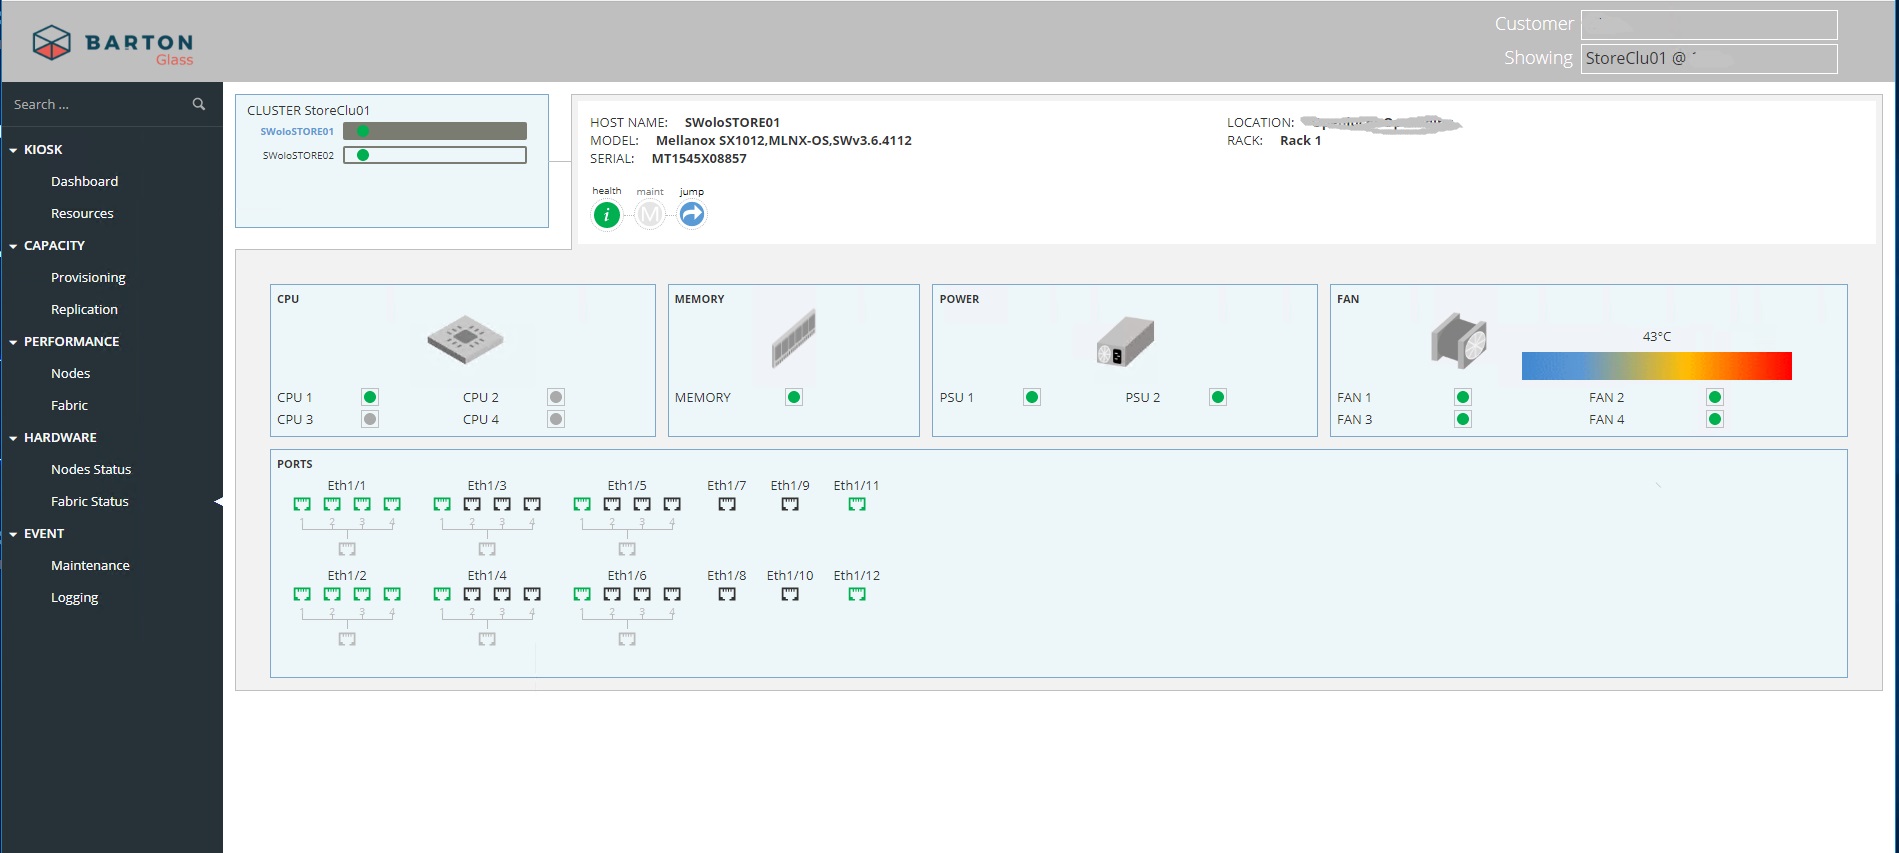
On the Hardware page for the node we get metrics sourced from the SNMP feed on the ILO/iDRAC of the cluster nodes.
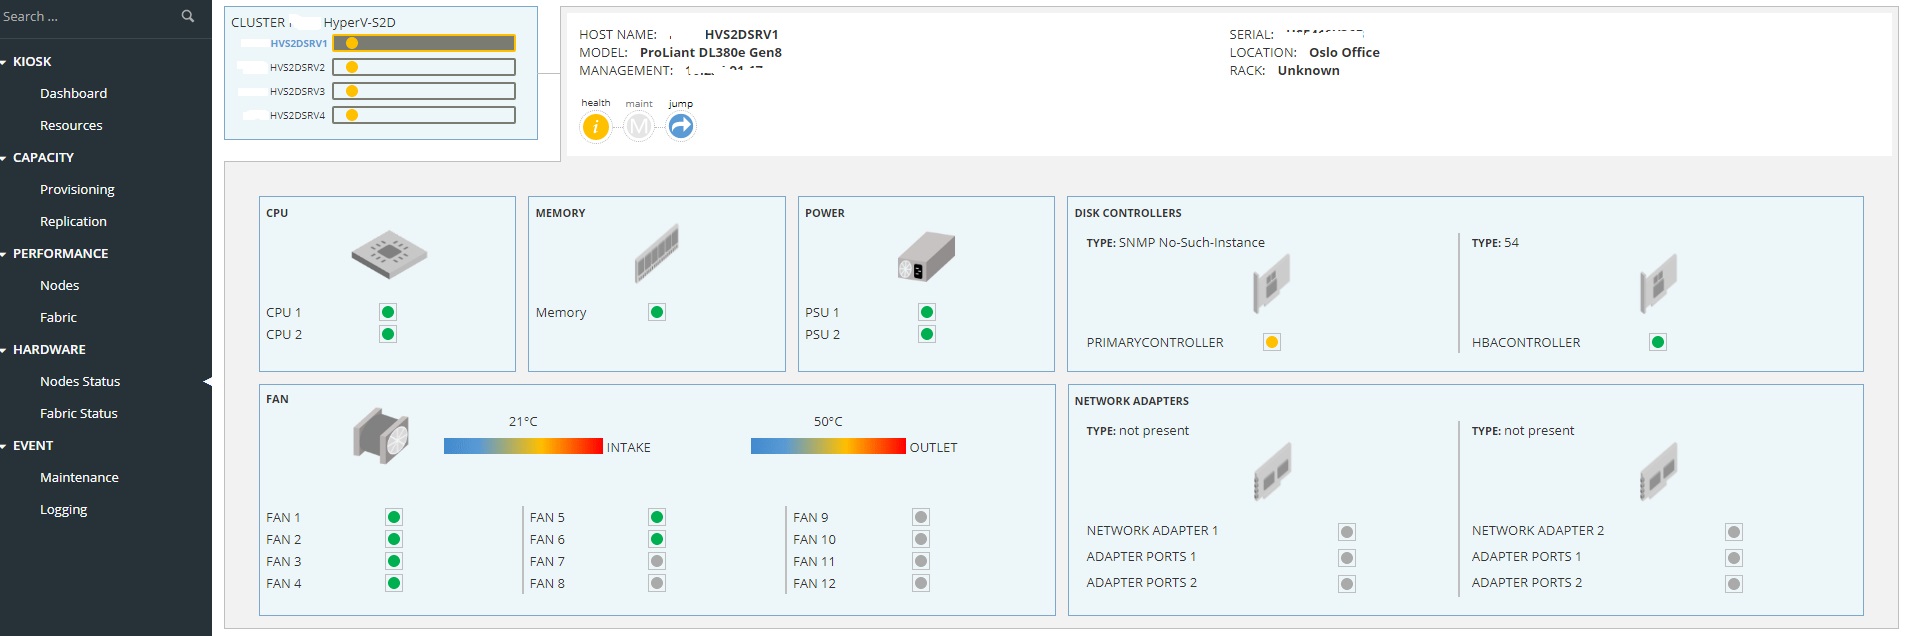
- CPU Status
- Memory Status
- PSU Status
- Boot disk Raid Controller Status
- HBA Status
- Fans and inlet and outlet temperatures
- NIC status
As this is a Gen 8 server and not all HP branded HW SNMP is not recognizing all the components correctly. Stay tuned for some screenshots from a HP Gen 9 cluster.
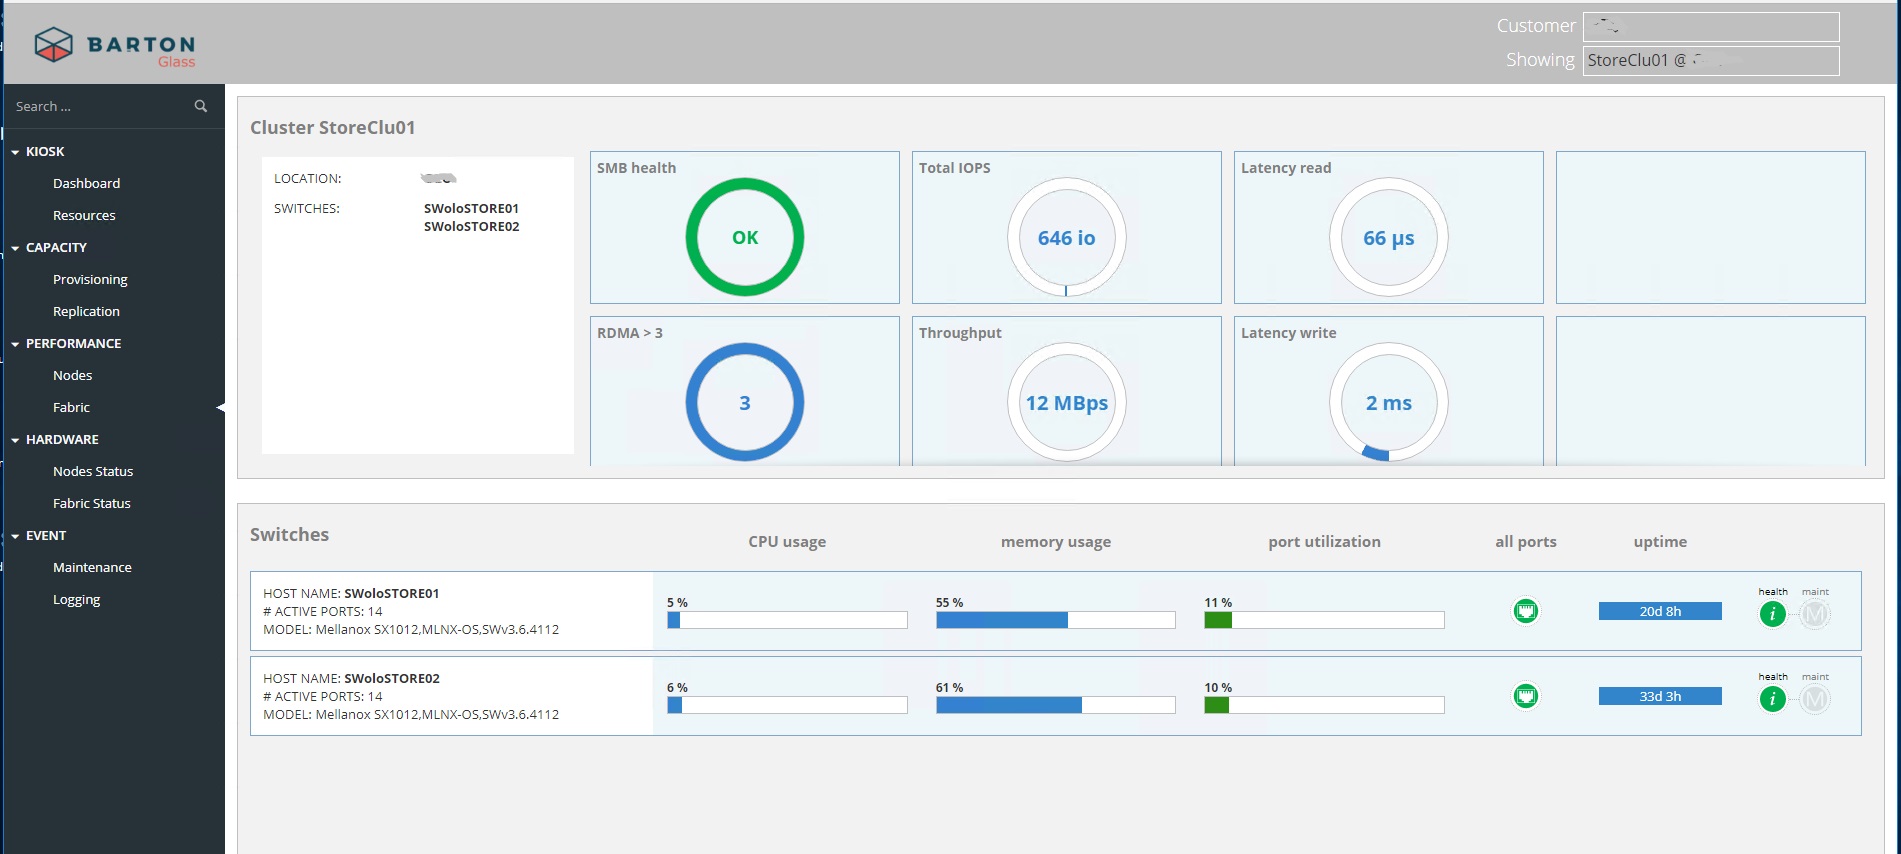
There is an identical Fabric page for the switches, but as we are missing the library for the S4810p switches this is not populated.
Adding a Barton provided screenshot here.
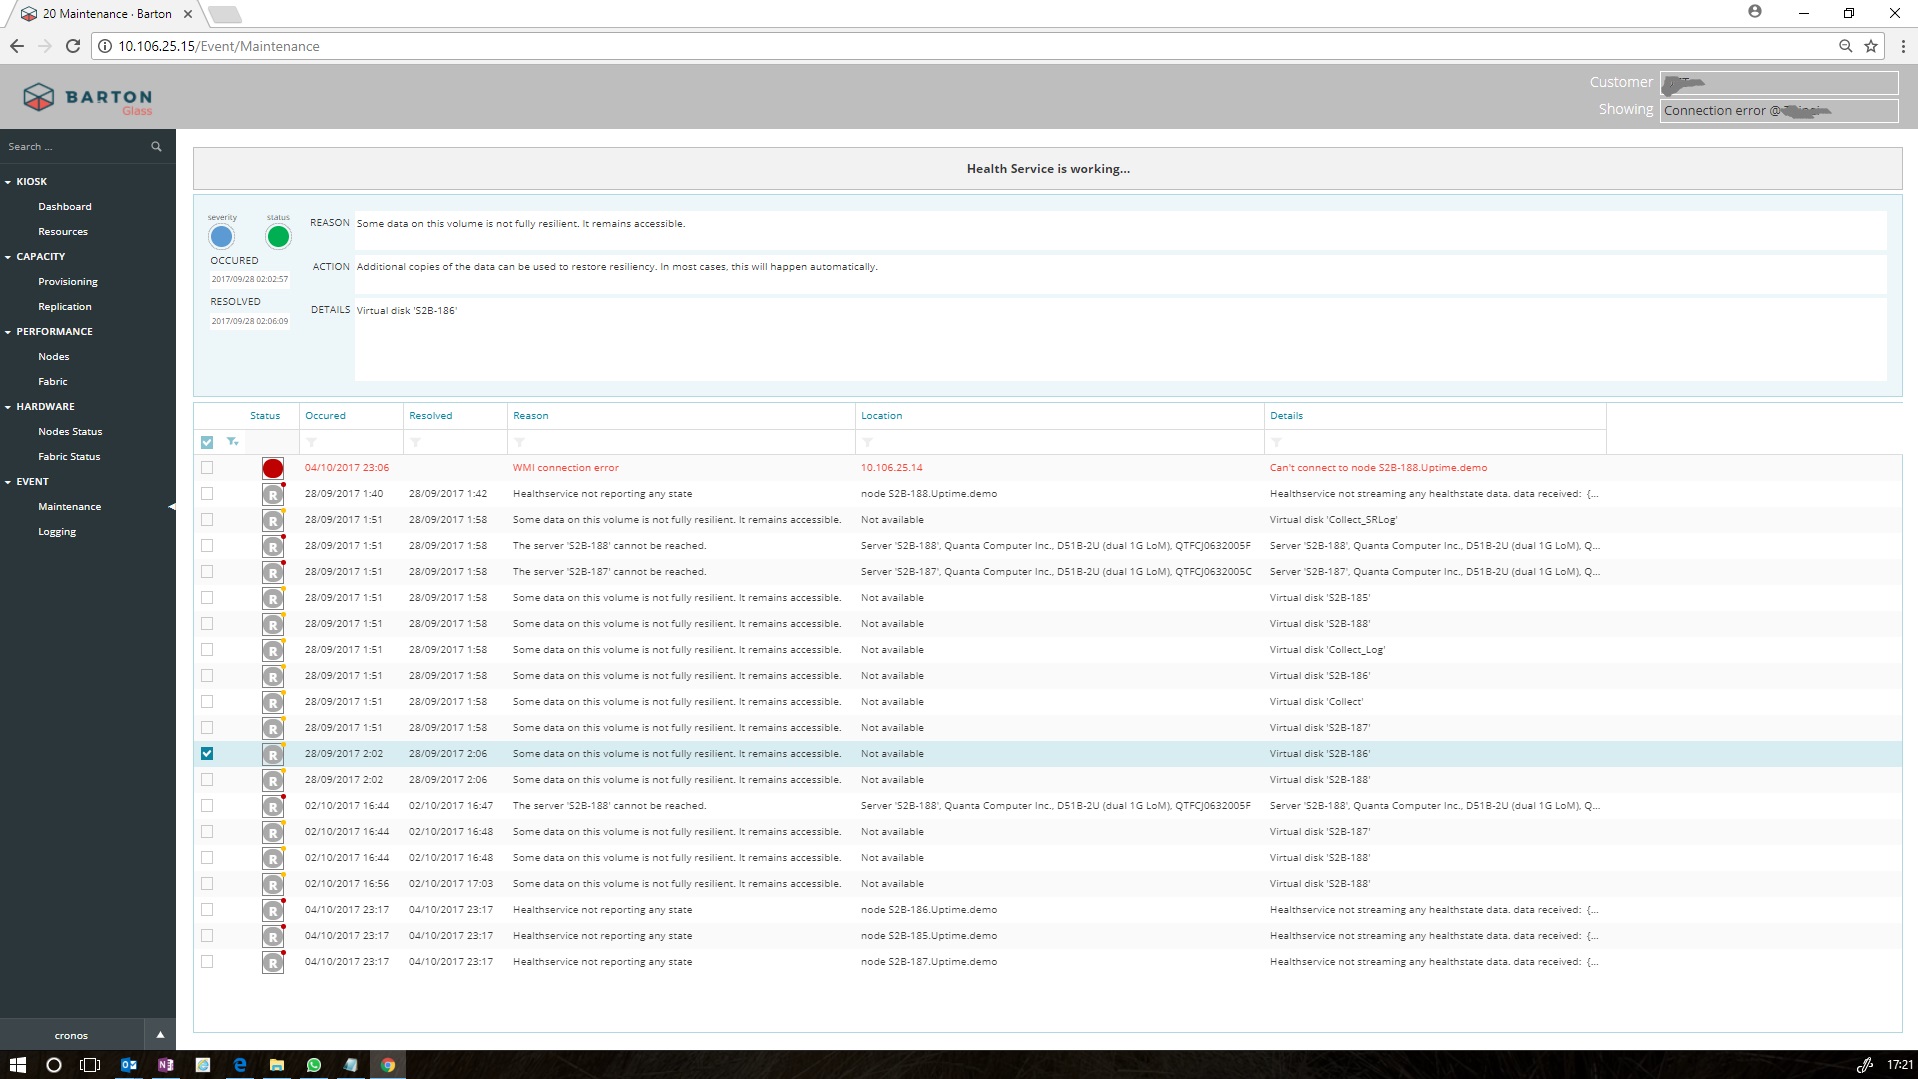
The maintenance page will show you any current problems with your S2D cluster.
This is a screenshot provided by Barton to show what it can show you.
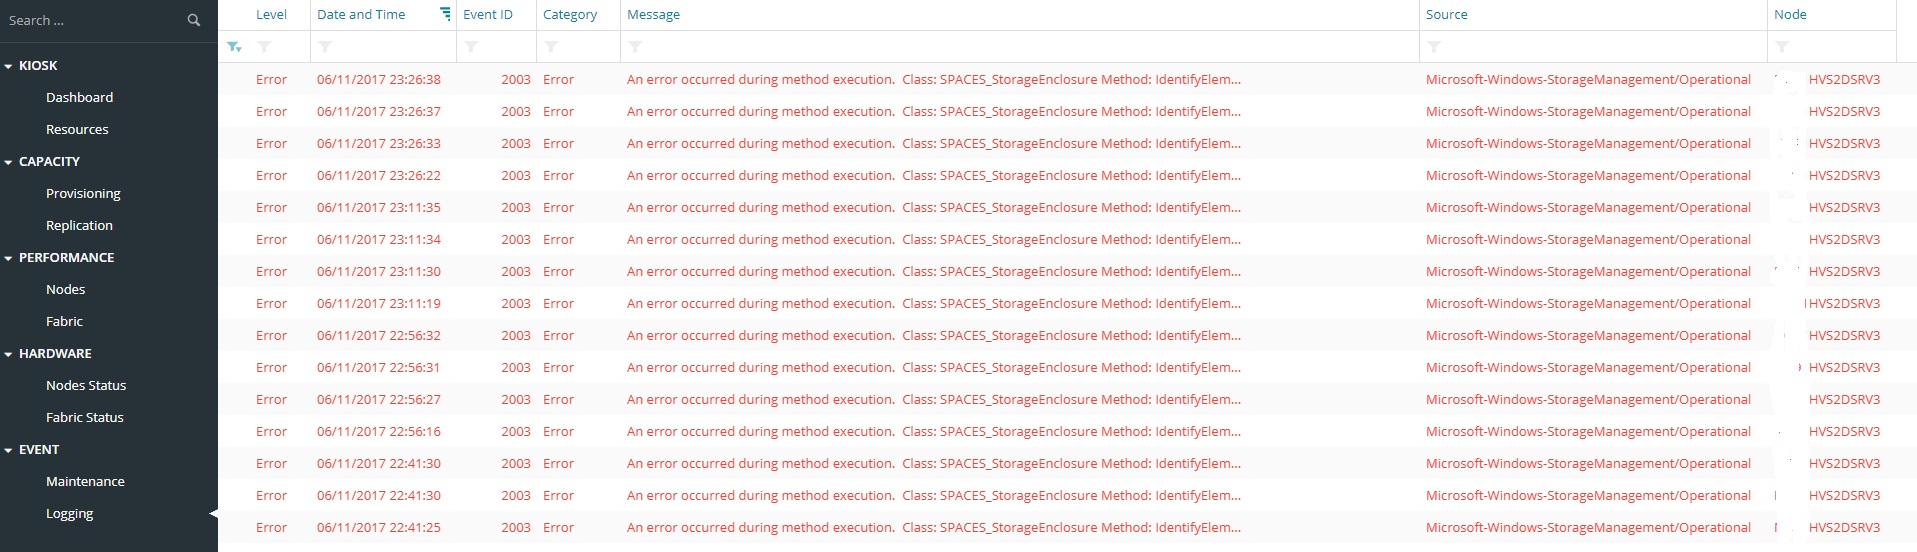
The logging page will show you logs from all the cluster nodes and Barton Glass VM. As this cluster is built on Gen 8 servers there are quite a few errors related to the Storage Enclosures.
On the settings page wich is not in final release yet. You will be able to add clusters, nodes, switches. Add users and edit them under here in the future. At the moment there is 1 hard coded user in the config file. Same with the cluster/node configuration.

Barton Glass was designed to be a fully understandable and comprehensive gui for an IT Department that do not have the experience or skills to manage there S2D solution. And is primarily offered as a fully managed service 24/7. But will be available as a installed monitoring gui for any S2D deployment.
Im looking forward to seeing where they are going with Barton Glass and how they will incorporate it further with S2D and new features that will come. Barton Glass is fully supported from HP Gen 9, Dell R740 and Lenovo M3500 series. They also have full support for Mellanox SN2000 series switches.